Introduction
In late summer 2022, a reporter for the Savannah Morning News visited with Betsy Cain of Wilmington Island, Georgia to get a sense of how homeowners in the Lowcountry were preparing for approaching Hurricane Ian. (1) The story describes a sanguine Cain, whose experience with decades of coastal storms had instilled in her both realistic expectations about potential impacts to her home as well as pushed her to undertake the major risk-reduction project of raising that home over ten feet from ground level. Cain had refused the state’s offer to purchase the property, opting instead to seek support from the Federal Emergency Management Administration (FEMA) to raise her home to adapt to the threats of a changing climate.
Rising sea levels combined with more frequent and intense storms are projected to alter the risks facing Georgia’s coastal communities, and Cain’s story exemplifies the essence of the challenge policymakers face: Residents, businesses, and other institutions are attached to the places they know; most will look for ways to adapt and stay put rather than migrate away from increasing risks. A major challenge for infrastructure systems of the future will be how to accommodate the changing needs of these coastal residents while also supporting adaptive natural systems that build a more robust resilience.
Roadways, in particular, and transportation infrastructure, more generally, are key features of our built environment that demand investments for climate adaptation. Betsy Cain’s home may be safe from damage because it has been lifted off the ground, but the roadways leading to her home cannot be rebuilt using the same strategy. The difficult reality is that roads and highways in coastal Georgia will be susceptible to more frequent and more extensive flooding in the years ahead, meaning that residents like Cain – not to mention the many businesses and other institutions in the area – are at risk of being cut off or saddled with major disruptions while transportation routes are impassable. To be sure, those disruptions can have major impacts for individuals and communities, especially when pathways to accessing or securing emergency services, healthcare, food, water, or other vital social services are affected.
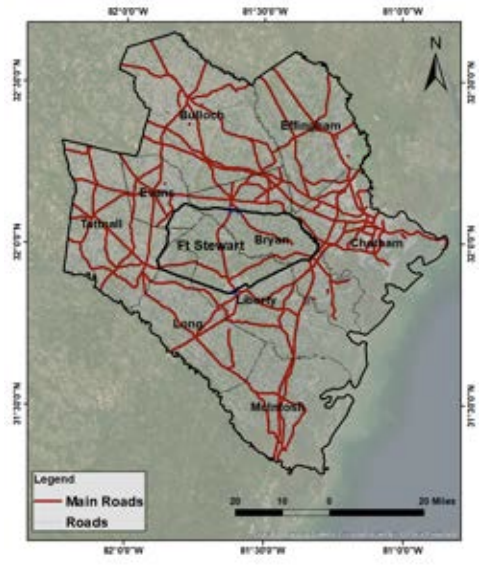
While the changing threats facing coastal residents pose many infrastructure challenges, migration is an option for most. However, there are coastal communities such as those that support port facilities and military installations that need to be located in coastal areas to support regional and national priorities such as global trade and national defense. Fort Stewart and Hunter Army Airfield (HAA), jointly operated military installations located in the Savannah metropolitan area, are a case study in how the issues highlighted in Betsy Cain’s story become orders of magnitude more complex when we think on a scale larger than the individual homeowner and examine complex facilities and their supporting human communities. Fort Stewart/HAA serves well over 65,000 people, including more than 15,000 active duty service members. It comprises over 22 million square feet of facilities, 135 miles of paved roads, 21 miles of railroads, an ocean terminal, and the Army’s longest runway, all of which support its role as the “Premier Power Projection Platform on the East Coast.” (2) That designation means that the Army operates Fort Stewart/HHA so that it can “load the biggest equipment in the Army inventory, and then deploy both equipment and Soldiers within an 18-hour wheels-up timeline to contingency operations anywhere in the world.” (3)
In addition to serving as a critical part of the U.S. national security infrastructure, Fort Stewart/HAA is an enormous economic driver in the Savannah region. The Army has estimated that Fort Stewart/HAA has a total economic impact of $4.9 billion each year, which gives a sense of the scale at which it relies on the surrounding area’s infrastructure. The airfield itself is located approximately 40 miles from Fort Stewart, along roads that skirt the marshes of Chatham, Bryan, and Liberty Counties. Meanwhile, Fort Stewart/HAA is dependent on the Savannah metropolitan area and its transportation network. Military personnel, their families, retirees, contractors, suppliers, and more are engaged in day-to-day activities that depend on functioning roadways. This codependence means that their long-term resilience in the face of climate change and worsening natural hazards requires an integrated and collaborative approach.
As part of our work with the University of Georgia’s Institute for Resilient Infrastructure Systems (IRIS), the Network for Engineering With Nature (N-EWN), and the Carl Vinson Institute of Government’s Defense Community Resilience Program, we have begun analyzing vulnerability to flooding in the communities surrounding Fort Stewart/HAA. We have compiled data from FEMA’s flood risk analyses, the Centers for Disease Control’s Social Vulnerability Index, and geospatial data regarding roads and critical infrastructure to map flood risks in the area.
Our work sets the stage for planned improvements to transportation infrastructure in the Savannah metro area that more effectively address climate change and changing risk profiles. The Coastal Region Metropolitan Planning Organization (CORE MPO), Hinesville Area MPO (HAMPO), and Georgia Department of Transportation (GDOT) are key audiences for the work. Under state and federal law, GDOT and the MPOs set long-term regional transportation policy, prioritize projects, and guide how millions of dollars in federal transportation infrastructure funds are spent. With the passage of the 2021 Infrastructure Investment and Jobs Act (sometimes referred to as the Bipartisan Infrastructure Law), not only has unprecedented money been set aside for highway and road improvements, but regional organizations like the CORE MPO and HAMPO have been encouraged to incorporate more climate resiliency planning into their work. The Department of Defense has, in recent years, also expanded its investments in off-base climate resiliency projects through its REPI and Sentinel Landscapes programs.
This report provides an initial look at our attempt to generate map products that quickly and cheaply assess changing flood risks and puts it in context as part of a long-term effort to publish novel and cutting-edge compound risk assessments for the Savannah region. The report begins with an overview of flood hazards in coastal Georgia and the communities at risk. It goes on to describe how the transportation planning system works. And then it reports on our mapping work to date, with an overview of implications for further research and practical uses.
Flood Hazards in Coastal Georgia
Coastal Georgia’s flood risks are driven by many hazards, four of which are of significant interest to transportation planners. Rainfall drives two types of flood hazard: pluvial and fluvial flooding. The nearby ocean adds two more: coastal storm surge and groundwater rise.
Pluvial flooding occurs when rainfall intensity exceeds the infiltration capacity of the land where it falls. Unable to infiltrate into the ground, rainwater will pool or flow across the ground, creating hazards that range from minor annoyances (puddles) to major risk factors for transportation systems (covered or damaged roadways). In undeveloped areas, soil conditions, ground cover, and topography are the major factors influencing pluvial flood risk. In more developed and urbanized areas, impervious surfaces abound, severely limiting the infiltration capacity of the land. Developed areas also have stormwater infrastructure that is integrated into urban landscapes and carefully engineered to work in tandem with transportation infrastructure. However, problems can arise due to the system either not being adequately designed (including as a result of not designing to account for climate change) or not performing to its design standards.
It is difficult to develop a comprehensive or systematic analysis of pluvial flood hazards for a given area, in part because the impacts are often localized, transient, and result in only minor damage. The impacts on daily life, though, must not be ignored. Our review of hazard mitigation plans developed by county governments in the vicinity of Savannah and Fort Stewart/HAA found repeated references to flooded roadways during heavy rainfall events. Local news sources regularly post coverage of flooding that appears to be pluvial. And the City of Savannah even maintains a list of roads to avoid during heavy rain events. (4)

Fluvial flooding happens when high waters overflow the banks of a river or stream. Most commonly, this flooding is caused by heavy rains within the stream’s watershed and the result is slow-flowing or standing water in the floodplain. Historically, floodplain management and zoning regulations were not always adequate to prevent development in floodplains, so homes and businesses, along with the transportation infrastructure to connect them, were put in harm’s way. In addition, development patterns that concentrate impervious landcover increase water flows and raise water levels in rivers and streams, exacerbating floods.

Coastal storms bring another set of hazards to the Savannah metropolitan area. The city sits on the bank of the Savannah River, and extends towards the Ogeechee River to the south and west. Much of the area is low-lying, with an extensive network of canals and tributaries that drain water to local rivers, marshes, sounds, and, eventually, the Atlantic Ocean. Downtown Savannah is fewer than twenty miles from the Atlantic, so coastal storms characterized by low-pressure and cyclonic winds (e.g., hurricanes, tropical storms, and nor’easters) create storm surges that significantly affect the Savannah area because of its topographical and hydrographical characteristics. Wave action from these storms also can threaten transportation infrastructure.
A recent example of this hazard is Hurricane Irma, which caused significant damage to coastal Georgia counties in September 2017. Data collected by the National Oceanic and Atmospheric Administration, as part of its Storm Events Database, indicates that Irma caused more than $29 million in damage in southeast Georgia, including $20 million in Chatham County, $900,000 in Bryan County, and $300,000 in Effingham County. In the broader area surrounding Fort Stewart, damages included $2.9 million in McIntosh County, $900,000 in Bulloch County, $200,000 in Evans County, $200,000 in Long County, and $200,000 in Tattnall County.5 Irma’s rain and wind destroyed homes, downed trees, and flooded roads across the area. Irma might be particularly noteworthy because the storm’s track came up through the Gulf of Mexico and traveled north-northwesterly through central Georgia; a storm tracking along the Georgia coast or making landfall in Georgia would likely bring much more extensive damage.
Groundwater rise is an emerging issue of concern in coastal Georgia. Historically, the depth from ground level to the water table below has fluctuated based on the seasons and precipitation. But in coastal areas, another factor is at play – sea-level rise. Where the ocean meets land, freshwater and saltwater meet underground. Saltwater is more dense than freshwater, so it tends to sink. As sea levels rise and the saltwater beneath the ground reaches farther inland, it has the effect of “pushing up” the freshwater and raising water tables. Rising water tables can create pooling water above ground as well as “hydrostatic uplift” that destabilizes roadways and other structures. Higher groundwater tables also reduce the infiltration capacity of local soils, which in turn can exacerbate pluvial and fluvial flooding.
While it can be useful, theoretically, to think of all of these flood hazards separately, in practice, they will happen simultaneously, creating what is known as compound hazards. A day’s thunderstorms, for instance, will likely cause both pluvial and fluvial flooding. Worse yet, heavy rains might be caused by a hurricane that tracks in a dangerous direction, aligns with a high tide, and drives storm surge into low-lying areas. As the effects of climate change unfold, such storms are likely to be more intense and frequent, and flood levels will be exacerbated by sea-level rise.
Communities at Risk
The Savannah metropolitan area is home to more than 400,000 people. Residents of the area are diverse in terms of demographics, employment, income, health status, educational background, housing, and every other factor that affects vulnerability to flood. While the characteristics of the area defy generalization, it is worth noting several features that are highly relevant to the analysis of flood risks and impacts related to transportation infrastructure.
First, for a metropolitan area, Savannah is not densely developed. Two-thirds of the housing is single-unit, detached housing, (6) leaving most residents dependent on personal vehicles to get to work and pursue other day-to-day activities. Over 90 percent of households have at least one vehicle available.7 A vast majority of workers in the area commute by car, truck, or van (87 percent) (8); fewer than 10 percent of commuters either carpool or utilize public transit. (9) Vehicle-dependent growth will likely continue into the future – researchers from Georgia Southern University and Georgia Tech, who produce regular economic reports on development, have found that Bryan County has been one of the fastest growing counties in the state and nation since 2010 and will likely continue. (10) They identified several new housing developments planned near new interchanges in the metropolitan area, with more than twice as many single-family homes planned as total units in multi-family residential developments. (11)
Second, the Savannah area economy is highly dependent on two sectors that could be severely hampered by inaccessible or damaged transportation infrastructure: shipping and tourism. Even through the COVID-19 pandemic, more than 16 million visitors came to Savannah each year, most of whom stayed overnight. Their direct spending contributed around $3 billion per year to the local economy and supported the leisure and hospitality sector, which is the second largest employment sector in the area. Researchers attribute the steady stream of visitors to the fact that Savannah is a “drive-to destination.” (12) The Port of Savannah is the country’s third busiest container gateway, moving more than four million “twenty-foot equivalent unit” shipping containers annually. (13) Part of the reason for the port’s success is that Interstates 16 and 95 provide shippers with efficient access to the southeast region’s inland markets. Georgia Ports Authority has planned expansions in the Port ofSavannah that could double the capacity of the port by the end of the decade. (14) Alongside the port, a large logistics and distribution industry is developing; it is the“number one growth market in the country for industrial/distribution development,” according to analysis performed for the Savannah Chamber of Commerce. (15)
Third, Fort Stewart and Hunter Army Airfield are a huge presence in the area. Fort Stewart covers roughly 280,000 acres in five counties. It started as an anti-aircraft training facility in 1940 when, to make room for the firing ranges and impact zones soldiers would use as they prepared to head overseas, the Army acquired property in roughly 60 rural communities, displacing about 2,000 local residents. (16) Today, Fort Stewart is the largest Army installation by acreage east of the Mississippi River. While it remains mostly undeveloped inside its boundaries, population growth and sprawling development from the Savannah area are beginning to encroach on operations. Hunter Army Airfield, meanwhile, sits closer to downtown Savannah. It operates under a joint command with Fort Stewart. Like all military installations, Fort Stewart/HAA depends on the surrounding community for contractors, civilian employees, educational and cultural opportunities, and various other amenities and support services. That is, Fort Stewart/HHA and the Savannah metropolitan area are inherently co-dependent.
Residents of the metropolitan area depend on a road network that is resilient to flooding, but the effects are much farther reaching. These three macro-level community characteristics are notable mainly because they show how, collectively, threats to the transportation system in Savannah have impacts far beyond the local community and can disrupt national trade pathways and affect military readiness. As policy makers debate how to make strategic infrastructure investments to ensure long-term prosperity, communities like Savannah that serve as hubs for regionally and nationally significant systems need to be prioritized.
Social Vulnerability in the Region
Successful transportation planning requires a more granular look at vulnerability and possibilities for building resilience. For instance, are certain neighborhoods more densely populated with residents who are over 65 years old or are disabled? These are factors that could significantly challenge their mobility if flooding affects roads. Are there areas of concentrated poverty, where disaster relief might be in high demand when flooding hits, and resilient infrastructure is invaluable for ensuring it arrives? One tool that can help begin to answer these questions is the Social Vulnerability Index (SVI), produced by the Centers for Disease Control and Prevention’s Agency for Toxic Substances and Disease Registry (CDC/ATSDR). The SVI is a relative measure of vulnerability calculated at the census tract level. Census tracts are geographic designations smaller than a county, designed to enable researchers to tease out variations in population demographics at a small scale. SVI is based on 16 factors including unemployment, racial and ethnic minority status, disability, and more. Table 1 shows the factors used in the most recent SVI analysis. CDC’s SVI is widely recognized as a useful tool for examining community-scale vulnerability.
| Socioeconomic Status | Below 150% Poverty Unemployed Housing Cost Burden No High School Diploma No Health Insurance |
| Household Characteristics | Aged 65 & Older Aged 17 & Younger Civilian with a Disability Single-Parent Household English Language Proficiency |
| Racial & Ethnic Minority Status | Hispanic or Latino (of any race) Black or African American, Not Hispanic or Latino Asian, Not Hispanic or Latino American Indian or Alaska Native, Not Hispanic or Latino Native Hawaiian or Pacific Islander, Not Hispanic or Latino Two or More Races, Not Hispanic or Latino Other Races, Not Hispanic or Latino |
| Housing Type & Transportation | Multi-Unit Structures Mobile Homes Crowding No Vehicle Group Quarters |
Social vulnerability, as captured in SVI data, intersects with flood hazards in many ways. For instance, a high SVI index can arise where a significant portion of the population has low income, resulting in high numbers of residents whose income is below 150% of the federally determined poverty level. While residents in these areas might have lower rent or mortgage payments because their property has a lower economic worth than elsewhere, the relationship of housing cost to income might reflect a high housing cost burden that makes recovering from a flood event harder and slower, especially if factors such as unemployment and inadequate access to health insurance factor into their lived experience. Or, consider the factors that relate to an individual’s ability to prepare, evacuate, and mitigate. Capacity or ability to do so may be significantly hampered in areas where we see more of the population in the “65 and older” or “17 and younger” category and where more people have disabilities. Racial and ethnic “minority” status also contribute to a high SVI and serious implications for flood risk management. While many material consequences of historic and structural racism are reflected in SVI variables in the socioeconomic and housing type and transportation categories, others are not and so the percentage of the population that identifies as African American, Native American, Asian, Pacific, and Hispanic adds nuance to the analysis. For example, the history of racial segregation and underinvestment in education could create challenges for certain schools and school systems to recover from flooding. Disrupted education can have long-term effects on students or even generational effects, and since school infrastructure quality is not directly measured by any SVI variable, it may be at least partially reflected in racial and ethnic status data. And communities with low proficiency in English are less likely to understand and follow preventive directions or evacuation plans. Housing and transportation factors are particularly important, in terms of evacuation. People living in apartments or group quarters such as nursing facilities or college dorms, where population density is higher, face increasing vulnerability when evacuation is needed due to overcrowding. And SVI data reflecting low automobile ownership rates, indicate potential problems for people who do not own a car or live in rural areas without access to evacuation routes.
We have mapped SVI data for the Savannah metropolitan area and counties surrounding Fort Stewart/HAA. See Map 3, below. Higher SVI values, shown in red and orange, indicate areas where residents need interventions from governmental and social institutions to avoid and recover from flood events. The main SVI drivers in these areas relate to the socioeconomic status and housing type and transportation categories, where most of the population in high and intermediate SVI areas subsist under the poverty line, suffer from high unemployment, live in crowded areas, and lack access to a vehicle. In Chatham county, high SVI is also driven by a significant number of residents in group quarters such as hospitals and schools, and by a high percentage of residents who are racial or ethnic “minorities” and have low English proficiency.

Stewart/HAA area.
From a public policy standpoint, it is important to recognize the implications of the fact that this map and the underlying SVI data are a snapshot in time. The variables that inform SVI are influenced by public policies going back decades, or even centuries. The legacies of chattel slavery and racist housing, education, and public health policies are reflected in disparities that we see in SVI data. (17) That is not to say social vulnerability is locked in. Policy changes can drastically change some SVI factors quickly. For example, federal interest rate changes have been shown to have a significant and rapid impact on unemployment rates among Black workers. Local economic development incentives can also cause significant changes to where people live and work, which may be of particular interest in the Savannah metropolitan area, where new manufacturing and warehousing/logistics operations are developing at a rapid pace. And with local zoning rules and land use or transportation planning policies that incorporate flood risks, housing patterns may shift in ways that reduce vulnerability.
Preparing the Transportation System
The preceding pages described the flood hazards in coastal Georgia and the communities at risk in the Savannah metropolitan area. Here, we provide an overview of how transportation planners can use that information to promote resilience.
First, though, a note on the concept of resilience. Resilience is a contested idea. On the one hand, experts from a variety of disciplines agree that the ideal for any individual, community, or system subjected to stress is that it can anticipate and withstand that stress, then “bounce back” when the stress is removed. The precise language used to describe this concept will vary across and within disciplines. The broad outlines are similar, but the exact definition can affect outcomes of resilience planning. (18) Furthermore, it must be noted that some public policy experts criticize the use of resilience as a cornerstone of public policy. They argue that more precautionary approaches to eliminating hazards should be the basis of public policy decisions, rather than building our social-political system around a need to endure hardship. (19)
“Resilience” as defined in the Infrastructure Investment and Jobs Act for Federal-Aid Highways
The term “resilience,” with respect to a project,
means a project with the ability to anticipate, prepare
for, or adapt to conditions or withstand, respond to,
or recover rapidly from disruptions, including the
ability–
(A)(i) to resist hazards or withstand impacts from
weather events and natural disasters; or (ii) to reduce
the magnitude or duration of impacts of a disruptive
weather event or natural disaster on a project; and
(B) to have the absorptive capacity, adaptive capacity,
and recoverability to decrease project vulnerability to
weather events or other natural disasters.’
Codified at 23 USC § 101(a)(24).
We adopt the resilience-centered approach here for two reasons. First, the global scientific consensus is that sea-level rise and stronger storms due to climate change are inevitable, creating an immediate need to develop public policies that respond to these hazards. At the global scale, we may be approaching tipping points where reversing the effects of historic greenhouse gas emissions is impossible. (20) At the very least, reversing the effects will take decades. Transportation system planning is constrained by time, resources, and authorities; therefore, climate-related hazards cannot be eliminated but must be managed instead, and using the concept of resilience to shape risk management decisions can have many positive outcomes. (21) Second, from a more practical standpoint, federal law dictates that it is in the national interest to “take into consideration resiliency needs…through metropolitan and statewide transportation planning processes,” (22) and recent federal legislation authorized major new funding streams for resiliency planning and project implementation. (23)
The remainder of this section addresses two key questions for resiliency-based planning: What will the future require, and how do we plan for it?
What will the future require?
The complexity of modern transportation networks makes it difficult to provide a concise overview of climate-adaptive, resiliency-oriented needs. Consider the interconnected modes of transportation in the Savannah metropolitan area, alone, where oceangoing vessels dock at intermodal facilities capable of moving cargo to surface roads and railways, interstate highways connect to local roads, and airports provide options for international and domestic travel. Rail lines and roads are needed to rapidly ship military equipment to any part of the globe on very little notice. Pedestrians and bicyclists share roadways with motorists. Public transit must connect people to housing, jobs, and sources of food, healthcare, and other basic needs. Even narrowing our focus to road transportation means we must consider different road and road bed materials, maintenance regimes, alignments along or over waterways, stormwater conveyance and collection, signals and signs, and various engineering guidelines. Thus the text that follows is not intended to be comprehensive, but rather illustrative of some ways that transportation infrastructure could be adapted to be more resilient to the threats posed by climate change in coastal Georgia.
Natural infrastructure and nature-based solutions to flood hazards should be a component of climate-resilient transportation infrastructure. For instance, protecting or restoring marshes can reduce wave energy from coastal storms that might otherwise damage roads. Engineered stormwater wetlands, which typically consist of a combination of open water, shallow marsh, and semi-wet areas, can be designed to detain stormwater, possibly to reduce stresses on transportation infrastructure while also providing water quality and biodiversity benefits. (24)
State agencies have more traditional engineering approaches at their disposal, too. (25) Using different materials for road bed and road surface construction can affect the extent of damage that occurs during a flood event and the time it takes to recover. Realigning or raising roads can reduce flood risk and increasing the capacity of ditches or culverts can ensure continuous access. Installing flood barriers is another option that can be employed to exclude floodwaters from discrete areas.
In addition to planning for changes to physical assets, transportation planners will need to think about the people, institutions, and knowledge base upon which those assets depend. A recent report from the National Academies’ National Cooperative Highway Research Program identified six “key building blocks to incorporate resilience into transportation planning:” (26)
- Leadership & agency structure
- Capacity & competency
- Collaboration & communication
- Resource requirements (including data)
- Risk & resilience assessment
- Business processes
In other words, there is a human and institutional infrastructure that needs at least as much attention from policymakers as the physical infrastructure of roads, bridges, culverts, and assets that need capital improvement.
How do we plan?
Future investments in transportation infrastructure are planned through a cooperative, comprehensive, and continuing process first introduced in the Federal Highway Act of 1962. Still today, the process involves local, state, and federal government agencies, regional organizations, and a variety of other stakeholders. In the pages that follow, we provide a brief overview of the planning process, with an emphasis on potential linkages to planning for climate resilience in the Savannah metropolitan area.
Under federal law, transportation system planning in large urbanized areas such as Savannah happens primarily through the auspices of a Metropolitan Planning Organization (MPO). MPOs are formed in urbanized areas with more than 50,000 residents, through an agreement between the local governments that represent at least 75 percent of that population. MPOs work closely with a state department of transportation. The MPO and the state department of transportation are both involved in planning transportation infrastructure investments, but it is the state department of transportation that has ultimate responsibility for most construction. Both agencies must develop long-term (20-year time horizon) plans for transportation system investments – the MPO develops a Metropolitan Transportation Plan (MTP), and the department of transportation develops a Long-Range Statewide Transportation Plan (LRSTP). They both also develop mid-term (4-year time horizon) plans called Transportation Improvement Programs (TIPs) and State Transportation Improvement Programs (STIPs), as well as more granular (1-2 year time horizon) agendas called Unified Planning Work Programs (UPWPs) and State Planning and Research Work Programs (SPR Work Programs). The reason for these separate but coordinated planning processes is that regions with more than 50,000 residents tend to have regional transportation needs that warrant focused planning efforts by dedicated staff. The state plans then incorporate the state’s various MPOs’ needs into a broader plan that also addresses the needs of more rural or sparsely populated areas within its borders.
| Who Develops? | Who Approves? | Time Horizon | Content | Update Requirements | |
| UPWP | MPO | MPO/FHW A/FTA | 1 or 2 Years | Planning Studies and Tasks | At Least Once Every 2 Years |
| SPR Work Program | State DOT | FHWA | 1 or 2 Years | Planning Studies and Tasks | At Least Once Every 2 Years |
| LRSTP | State DOT | State DOT | 20 Years | Future Goals, Strategies, and can include Projects | Not Specified |
| MTP | MPO | MPO | 20 Years | Future Goals, Strategies, and can include Projects | Every 5 Years (4 years for nonattainment and maintenance areas) |
| TIP | MPO | MPO | 4 Years | Transportation Investments | Every 4 Years |
| STIP | State DOT | FHW A/FTA | 4 Years | Transportation Investments | Every 4 Years |
In Savannah, the MPO is called the Coastal Region (CORE) MPO. It comprises parts of Chatham and Effingham Counties, plus nine cities and towns (Bloomingdale, Garden City, Port Wentworth, Pooler, Richmond Hill, Savannah, Tybee Island, Thunderbolt, and Vernonburg). Because the area has more than 200,000 residents, the CORE MPO is subject to special rules for “Transportation Management Areas,” a federal designation that recognizes the unique challenges of large urban areas (e.g., congestion issues and issues related to linking transportation and housing). South and west of Fort Stewart is the Hinesville Area MPO (HAMPO), which comprises parts of Liberty and Long Counties, plus seven municipalities (Hinesville, Allenhurst, Flemington, Gum Branch, Midway, Riceboro, and Walthourville).

The Federal Highway Administration (FHWA) plays an oversight role in the transportation infrastructure planning process. The FHWA reviews MPOs’ Unified Planning Work Programs and state transportation departments’ STIPs and SPR Work Programs, ensuring that the various efforts comply with federal laws. Among the review criteria the FHWA uses is whether the planning processes are done in service of the national interest as set out by Congress, which begins with safety and efficiency but also includes other important value propositions including meeting mobility needs of communities, promoting economic development, and consideration of resiliency needs. (27) The FHWA also ensures that the planning processes meet the scoping requirements set out by Congress. Those scoping requirements list ten categories of analysis, one of which is that planning “shall provide for consideration of projects and strategies that will … improve the resiliency and reliability of the transportation system and reduce or mitigate stormwater impacts of surface transportation.” (28) The FHWA examines whether the MPO or state process and plan aligns with the national goals and performance targets established in various federal statutes. Once FHWA has approved a UPWP, SPR Work Program, and/or STIP, federal funds can flow to the state following annual federal appropriations legislation.
Justice and Equity in Transportation Planning
All transportation planning and construction work conducted with federal funds must comply with various anti-discrimination laws, including Title VI of the Civil Rights Act of 1964 and the Americans with Disabilities Act. Moreover, the FHWA, in its roles overseeing MPO and DOT planning and construction funding, operates according to Environmental and Climate Justice principles articulated in various Executive Orders. Briefly, these federal mandates and their linkages to our work are:
Title VI – Prohibits discrimination based on race, color, or national origin. Planners should consider how climate resiliency investments affect the distribution of risks.
ADA – Ensures pedestrians with disabilities have equal opportunity to use public rights-of-way. Improving roadways for climate resilience must incorporate improvements for pedestrians with disabilities.
Executive Orders 12898 and 14096 – Ensure just treatment and meaningful involvement of all people in federal activities that affect human health and the environment. Planning processes must provide public engagement opportunities, and the investments should avoid disproportionate impacts and ensure equitable access to a resilient environment.
Executive Order 14008 – Launched the Justice40 Initiative, which requires 40 percent of the benefits of certain climate-related federal investments to be delivered to disadvantaged communities.
In addition to these longstanding requirements to address resiliency issues in MTPs and related planning processes (which date back to federal legislation from 1998), Congress’s enactment of the Infrastructure Investment and Jobs Act in 2021 established a new program that significantly enhances the funding opportunities for planning and project development focused on climate resiliency. It is known as the PROTECT Program, for “Promoting Resilient Operations for Transformative, Efficient, and Cost-saving Transportation.” It sets aside a certain percentage of each state’s annual apportionment from federal highway funds and designates that money for planning and improvements that will ensure the state’s transportation infrastructure is more resilient to flooding, severe storms, sea-level rise, and other “current and future weather events and natural disasters.” (29) Congress even mandated that some PROTECT Program funds be reserved especially for “at-risk coastal infrastructure grants,” to be used for:
strengthening, stabilizing, hardening, elevating, relocating, or otherwise enhancing the resilience of highway and non-rail infrastructure, including bridges, roads, pedestrian walkways, and bicycle lanes, and associated infrastructure, such as culverts and tide gates to protect highways, that are subject to, or face increased long-term future risks of, a weather event, a natural disaster, or changing conditions, including coastal flooding, coastal erosion, wave action, storm surge, or sea level rise, in order to improve transportation and public safety and to reduce costs by avoiding larger future maintenance or rebuilding costs. (30)
To encourage wise use of PROTECT funds, the IIJA included a provision that increases the federal cost-share for projects undertaken with PROTECT funds when an MPO or state transportation department has developed a “Resilience Improvement Plan” and incorporated it into its MTP or LRSTP. (31) By law, a Resilience Improvement Plan must have certain characteristics, but the process for developing one and the precise content are determined mostly by the relevant MPO or state transportation department. The mandatory features are:
- It must be for immediate and long-range planning activities and investments,
- It must demonstrate a “systemic approach” to resilience and be consistent and complementary with FEMA-approved hazard mitigation plans, and
- It must include a risk-based assessment of vulnerabilities of transportation assets and systems to current and future weather events and natural disasters (including severe storms, flooding, sea-level rise and more). (32)
In addition to those required features, Congress suggested a number of additional elements that Resilience Improvement Plans shall incorporate, “as appropriate,” including several that are relevant to our analysis of flood vulnerability and opportunities for improvements. Congress suggested, for instance, that Resilience Improvement Plans should assume nonstationarity by describing how the plan will improve the state’s or MPO’s ability to be prepared for sea-level rise and increased flooding; and they should consider the benefits of combining hard infrastructure with natural infrastructure. (33)
The 2021 Infrastructure Investment and Jobs Act also amended several provisions of the National Highway Performance Program. This program governs how state departments of transportation manage certain transportation assets. The recent amendments promote state-level activities that will increase the resilience of the National Highway System and mitigate the cost of damages from sea-level rise, flooding, and more. (34) It does so by mandating that state transportation departments’ asset management plans include “lifecycle cost and risk management analyses, both of which shall take into consideration extreme weather and resilience.” (35) Among the “protective features” encouraged under the new law are:
- Raising roadway grades;
- Relocating roadways in a base floodplain to higher ground above projected flood elevation levels or away from slide prone areas;
- Lengthening or raising bridges to increase waterway openings;
- Increasing the size or number of drainage structures;
- Replacing culverts with bridges or upsizing culverts;
- Adding scour protection at bridges, installing riprap, or adding other scour, stream stability, coastal, or other hydraulic countermeasures, including spur dikes; and
- The use of natural infrastructure to mitigate the risk of recurring damage or the cost of future repair from extreme weather events, flooding, or other natural disasters. (36)
A third feature of the 2021 Infrastructure Investment and Jobs Act that creates incentives for MPOs and state transportation departments to consider climate resiliency involves changes to the Surface Transportation Block Grant Program. The new law amended the block grant program to explicitly allow for its funds to be used for “protective features, including natural infrastructure, to enhance the resilience of a transportation facility.” (37)
Combined, the MTP/LRSTP planning process, PROTECT Program, National Highway Performance Program, and the Surface Transportation Block Grant Program shape how a substantial amount of a state’s annual federal aid for roads is distributed, so the focus on resilience across these programs is noteworthy. The CORE MPO, HAMPO, and GDOT could utilize the type of analysis our team has undertaken to better understand resiliency needs and plan future investments. Indeed, in a recent report from the National Academies’ National Cooperative Highway Research Program, a team of experts recommends a similar type of analysis be conducted as part of the asset management work, although their recommendation does not go as far as what we have explored, in terms of factoring social vulnerability into the analysis. (38)
Mapping Vulnerability
Having provided an overview of the flood hazards in coastal Georgia, the communities at risk from flood-related transportation system impacts in the Savannah-Fort Stewart/HAA area, and the engineering and legal context for climate-resilient transportation infrastructure improvement planning, we now present our GIS-based analysis of flood vulnerability.
Our work to date involves a simplified analysis, using limited data sets, to create a
starting point for future analyses. At its core, our work is rooted in the concept:
Flood Risk = Hazard x Vulnerability x Exposure
To employ this concept in a GIS application, we used existing sources that have readily available shapefiles based on robust data.
For our hazard variable, we used the flood zones from Federal Emergency Management Administration’s (FEMA’s) Flood Insurance Rate Maps (FIRMs). FEMA is responsible for the National Flood Insurance Program, and as part of that work has undertaken extensive mapping work across the country. In coastal Georgia, FIRM coverage for our study area is nearly complete, minus some areas inside Fort Stewart’s military installations and small areas where there was not enough data to make an assessment. FEMA has created maps depicting areas expected to be inundated with floods that have a 1 percent and 0.2 percent annual chance of occurring (colloquially, 100-year and 500-year floods). The 1 percent annual-chance flood is known as the “Base Flood,” and FEMA also determines the “Base Flood Elevation” for that flood. That is, FEMA maps show both the extent of land that will be inundated and the height to which waters are expected to rise at any given point in that area, which can range from inches to feet depending on a variety of factors. Based on its analysis, FEMA has designated various flood zones, which generally correspond to “high-risk areas,” “moderate-to-low-risk areas,” and “undetermined-risk areas.”
For purposes of this analysis, we mapped five of FEMA’s flood zones:
- Zone A: Area inundated by the Base Flood; no Base Flood Elevation determined
- Zone AE: Area inundated by the Base Flood; Base Flood Elevation has been
- determined
- Zone AH: Area inundated by the Base Flood, with Base Flood Elevation 1-3 feet
- Zone VE: Coastal flood zone with velocity hazard (wave action); Base Flood Elevation has been determined
- Zone X: Area outside the 0.2 percent annual chance floodplain
Map 5 depicts these flood zones in our study area. Since Zone X (the area outside the “500-year floodplain”) is depicted in a green color, all other areas colored blue, purple, maroon, and pink on this map are likely to be inundated in any flood event with greater than 0.2 percent annual chance of occurrence.

For our vulnerability variable, we used CDC’s SVI data. As noted above, SVI data provides a measure of relative vulnerability; that is, it is indexed to a national average. The map is rendered at a 25-meter scale, and we classified each 25m x 25m pixel on the map as “high,” “moderate,” or “low” vulnerability. High vulnerability areas are in roughly the 71st to 99th percentile SVI; moderate vulnerability areas are 40th to 70th percentile SVI; and low vulnerability is 40th percentile SVI and below. Map 6, below, shows the SVI for the study area classified according to this methodology.

For our exposure variable, we mapped roads and other important infrastructure, using data from readily available public sources. We mapped surface roads and highways, as well as the locations of emergency services, hospitals, schools, power generation facilities, cell towers, and more. We selected these points of interest because they are critical to daily life and should be readily accessible by road and unaffected by flooding. Schools also often serve as emergency shelters or distribution centers for emergency aid following floods.

By combining all three variables, we developed a rapid risk assessment for the study area. That risk assessment is rendered at a 25-meter scale, classifying each 25m x 25m pixel on the map as “high,” “moderate,” or “low” risk. Our three variables – hazard, vulnerability, and exposure – are normalized to a rating of 1 (low), 2 (moderate), or 3 (high), then multiplied together to determine an overall risk assessment. Our methodology is represented graphically in Figure 1, below.

The end results are depicted cartographically in Maps 9 and 10, below. The areas colored red are generally high-hazard flood zones with vulnerable populations and roads or other critical infrastructure at risk of flood damage. The areas colored orange should also garner some attention, since flood hazards exist and both of the other risk-related variables must be elevated to warrant the overall “moderate risk” characterization.

This mapping exercise might be a valuable starting point for transportation planners at CORE MPO, HAMPO, and GDOT. Federal mandates and funding opportunities tied to climate resilience create incentives to analyze flood risks in a manner such as this, and could provide support for further improvements and more robust linkages to the development of Metropolitan Transportation Plans (MTPs), and GDOT’s Long-Range Statewide Transportation Plan (LRSTP).
We have plans to use additional sources of information to improve our risk assessment. For example, we are exploring how we might use information available through the US Army Corps of Engineers’ South Atlantic Coastal Study (SACS) to increase the accuracy of our flood hazard variable. FEMA’s maps have been criticized for being developed based on historical data, without adequate consideration of how global climate change might affect future flooding. The SACS data, by contrast, provide flood extent and depth information based on a variety of future climate scenarios for coastal flooding. With the use of new data from SACS and other sources, we aim to refine our hazard maps for compound flooding (i.e., riverine plus coastal flood hazards) in the areas surrounding Fort Stewart/HAA in ways that will help improve the urban planning for further road and housing design. We also plan to expand our methodology to incorporate hydrodynamic compound modeling for the transition zone (riverine-coastal flood) and assess how the implementation of nature-based solutions might enhance mobility and quality life. For instance, green stormwater infrastructure might improve infiltration, reduce pluvial flooding, and also provide aesthetic benefits or mitigate urban heat island effects. Marsh restoration could reduce the extent of coastal flooding while also providing recreational benefits. New modeling will allow us to test these hypotheses.
Conclusion
Across the US, people living in coastal communities go about their daily lives with an awareness that they face hazards of flooding, coastal storms, and sea-level rise; yet for the most part, their preparations and risk mitigation efforts are fairly minimal. This is no criticism. Rather, it is a point of fact that emphasizes the importance of government institutions that can utilize cutting-edge analytical tools to identify risks and manage them for the benefit of society. Transportation system planners are a critical component of that work. And while they have deep expertise in forecasting demand for transportation infrastructure construction and repair based on development patterns, wear-and-tear, and other community needs, planning for climate resilience is a relatively recent addition to their mission. The rapid flood risk assessment model we have developed holds promise not only for GDOT and the MPOs that cover our study area, but for planners across the country.
Acknowledgement of support: This project is supported by the Network for Engineering With Nature (www.n-ewn.org) and the University of Georgia’s Defense Community Resilience Program in the Carl Vinson Institute of Government. It was supported by the Army Corps of Engineers Awards W912HZ-21-2-0041 and W912HZ-23-2-0018.
Footnotes
- Marisa Mecke, “Tropical Storm Ian: Georgia’s seasonal high tides will cause flooding as storm comes ashore,” Savannah Morning News, Sept. 29, 2022, at https://www.savannahnow.com/story/news/2022/09/29/hurricane-ian-impact-savannah-ga-flooding-preparation/10439077002/
- “Fort Stewart & Hunter Army Airfield, Georgia: Economic Impact Analysis and Partner Summary; Fiscal Year 2019 (01 Oct 18 – 30 Sep 19),” available at https://home.army.mil/stewart/application/files/5215/8022/1134/FS_HAAF_EIA__for_Jan._27.pdf
- “About Fort Stewart & Hunter Army Airfield,” at https://home.army.mil/stewart/about
- City of Savannah, Flood Protection Information, at https://www.savannahga.gov/936/Flood-Protection-Information
- National Oceanic and Atmospheric Administration, National Centers for Environmental Information, Storm Events Database – Event Details, at https://www.ncdc.noaa.gov/stormevents/eventdetails.jsp?id=722428
- US Census Bureau, American Community Survey, CP04 Comparative Housing Characteristics, 2021: ACS 1-Year Estimates Comparison Profiles, at https://data.census.gov/table?t=Units+and+Stories+in+Structure&g=310XX00US42340&tid=ACSCP1Y2021.CP04
- Id.
- US Census Bureau, American Community Survey, SO801, Commuting Characteristics by Sex, 2021: ACS 1-Year Estimates Subject Tables, at https://data.census.gov/table?t=Commuting&g=310XX00US42340
- Id.
- Savannah Area Chamber of Commerce, The University of Georgia Terry College of Business, and Georgia Southern University Parker College of Business, Savannah 2023 Economic Trends (Jan. 2023), at http://savannah.uberflip.com/i/1489710-2023-economic-trends-brochure/27
- Savannah Area Chamber of Commerce, The University of Georgia Terry College of Business, and Georgia Southern University Parker College of Business, Savannah 2023 Economic Trends (Jan. 2023), at http://savannah.uberflip.com/i/1489710-2023-economic-trends-brochure/33
- Savannah Area Chamber of Commerce, The University of Georgia Terry College of Business, and Georgia Southern University Parker College of Business, Savannah 2023 Economic Trends (Jan. 2023), at http://savannah.uberflip.com/i/1489710-2023-economic-trends-brochure/31
- Georgia Ports, Cargo – Container – Overview, at https://gaports.com/cargo/container/
- Savannah Area Chamber of Commerce, The University of Georgia Terry College of Business, and Georgia Southern University Parker College of Business, Savannah 2023 Economic Trends (Jan. 2023), at http://savannah.uberflip.com/i/1489710-2023-economic-trends-brochure/31
- Savannah Area Chamber of Commerce, The University of Georgia Terry College of Business, and Georgia Southern University Parker College of Business, Savannah 2023 Economic Trends (Jan. 2023), at http://savannah.uberflip.com/i/1489710-2023-economic-trends-brochure/35
- Jeff White, “Before there was Fort Stewart,” Bryan County News, Apr. 28, 2017, at https://www.bryancountynews.com/news/military/before-there-was-fort-stewart/
- See, e.g., Richard Rothstein, The Color of Law: A Forgotten History of How Our Government Segregated America (2017).
- Sara Meerow and Joshua P. Newell, Urban resilience for whom, what, when, where, and why? 40 Urban Geography 309 (2019), https://doi.org/10.1080/02723638.2016.1206395
- John Patrick Leary, “Resilience Is the Goal of Governments and Employers Who Expect People to Endure Crisis,” Teen Vogue, July 1, 2020, https://www.teenvogue.com/story/whats-wrong-with-focus-on-resilience
- Intergovernmental Panel on Climate Change, Sixth Assessment Report of the Intergovernmental Panel on Climate Change, Climate Change 2021: The Physical Science Basis, Summary for Policymakers (2021), https://www.ipcc.ch/report/ar6/wg1/downloads/report/IPCC_AR6_WGI_Full_Report.pdf
- See K.M. de Bruijn, Resilience and flood risk management, 6 Water Policy 53 (2004), https://doi.org/10.2166/wp.2004.0004; and Disse et al., Exploring the relation between flood risk management and flood resilience, 9 Water Security 100059 (2020), https://doi.org/10.1016/j.wasec.2020.100059
- 23 USC § 134(a).
- See Infrastructure Investment and Jobs Act, Pub. L. 117-58, div. A, title I, §§ 11103, 11105, 11109, 11405, 135 Stat. 453, 457, 461, 561 (Nov. 15, 2021).
- Georgia Department of Natural Resources, Environmental Protection Division, Coastal Stormwater Supplement to the Georgia Stormwater Management Manual, at 8-35 through 8-46 (2009), available at https://epd.georgia.gov/watershed-protection-branch/storm-water/georgia-epd-coastal-stormwater-supplement-stormwater
- https://highways.dot.gov/public-roads/autumn-2018/boosting-pavement-resilience
- National Academies of Science, Engineering, and Mathematics, Transportation Research Board, National Cooperative Highway Research Program, Integrating Resilience Concepts and Strategies into Transportation Planning: A Guide (2023), https://nap.nationalacademies.org/catalog/27192/integrating-resilience-concepts-and-strategies-into-transportation-planning-a-guide
- 23 USC § 134(a)(1).
- 23 USC § 134(h)(1)(I).
- 23 USC § 176(b)(2).
- Infrastructure Investment and Jobs Act, Pub. L. 117-58, div. A, title I, § 11405(a), 135 Stat. 568 (Nov. 15, 2021); codified at 23 USC § 176(d)(4)(C)(iii).
- 23 USC § 176(e).
- 23 USC § 176(e)(2)(A)-(C).
- 23 USC § 176(e)(2)(E).
- Infrastructure Investment and Jobs Act, Pub. L. 117-58, div. A, title I, § 11105, 135 Stat. 457 (Nov. 15, 2021); codified at 23 USC § 119
- 23 USC § 119(e)(4)(D).
- 23 USC § 119(k)(2)
- Infrastructure Investment and Jobs Act, Pub. L. 117-58, div. A, title I, § 11109(a)(1)(F), 135 Stat. 462 (Nov. 15, 2021); codified at 23 USC § 133(b)(18).
- See National Academies of Sciences, Engineering, and Medicine, Metropolitan Planning Organizations: Strategies for Future Success, at 29-30 (2022), https://doi.org/10.17226/26555